Update Date: August - 2024
Carlos Alegria, Yuri Nunes
Link to Pre-print paper: Paper Link
Other components of Liver Disease Deaths report:
Navigation to related reports:
US - Trends in death rates from Neoplasms, Ages 15-44
US - Trends in death rates from Neoplasms for all ages and detailed analysis of 75-84
US - Estimating Covid-19 over-reporting as underlying cause of death.
US - Trends in death rates from Neurological Diseases for all ages and detailed analysis of 15-44.
US - Trends in death rates from Acute Renal Failure (N17) for all ages and detailed analysis of 35-44.
US - Trends in death rates from Musculoskeletal Diseases (M00-M99) for all ages and detailed analysis of 75-84.
We generalise for all age groups the detailed analysis of trends in death rates from liver diseases. We compute the excess deaths (deviation from 2013-2019 trend) from liver diseases (ICD-10 codes: K70-K76) for the different age groups in the US.
The data for age groups 1, 1-4 and 5-14 cannot be computed as the number of deaths in these age groups are very low, falling below CDC suppression limitations that do not allow for publication.
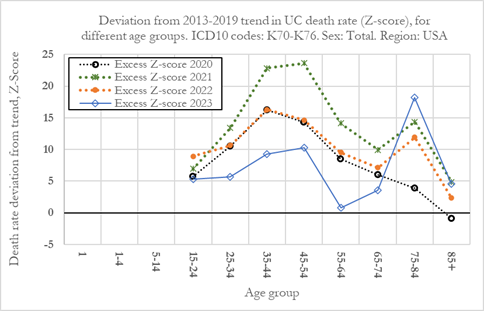
In this section, we compute for all age groups, the excess UC death rates from liver diseases in 2020, 2021, 2022 and 2023, shown in the Figure below. The detailed results are also shown in the full paper, in the tables in section 8.1 of the appendix. The left Figure shows the excess UC death rate (in percent) and in the right Figure the respective Z-scores are shown. Each datapoint on the graphs is obtained by performing the analysis described in the methodology section where the extrapolated 2013-2019 trendline in death rates is subtracted from the death rates in 2020, 2021, 2022 and 2023, for each of the age groups.


The results from the Figures above show that the excess UC death rates from liver diseases had a higher impact (in percentage terms) on younger individuals when compared to older individuals. The results show that excess death rates tend to be higher the lower the age-group, with the 15-24 age group being the most impacted with increased liver disease death rates. As for older individuals, aged 75 and above, they experienced much lower excess death rates in 2020, 2021, 2022 and 2023.
For individuals aged 65 and younger, the Figures above show that we observe statistically significant excess death rates from liver diseases, that started in 2020, peaked in 2021 and then dropped in 2022 and 2023. The pattern of excess deaths from liver diseases for these age groups closely tracks changes in all-cause mortality from 2020 to 2023. For example, within these age groups, as shown in the Figure, the largest percentage of excess deaths were observed in the 15-24 age group, where excess death rates were 45.4% (Z-score: 5.7) in 2020, 55.1% (Z-Score: 6.9) in 2021, 70.9% (Z-Score: 8.9) in 2022 and 42.5% (Z-Score: 5.4) in 2023. For a more detailed analysis see section 8.1 in the appendix of the full paper shows all the individual values that are plotted in the Figure above.
As we’ve shown previously in Figure 4, for younger individuals, alcoholic liver disease was the main contributor to changes in death rates from liver diseases from 2020 to 2023. Consequently, increased levels of alcohol consumption during the pandemic years, could be a contributory factor towards increased liver disease deaths (Slater & Alpert, 2024).
The pattern of excess deaths was different for individuals aged 75 and above, showing much lower excess death rates (in percentage terms) than those for younger age groups. Notwithstanding, the statistical significance of the excess deaths rates show very high statistical significance from 2021 onwards, due to the larger sample sizes for older individuals when compared to younger individuals. For older individuals, excess deaths rose consecutively from 2020 to 2023, with the main increase in excess mortality starting in 2021 and not in 2020 as was the case for younger individuals. As we’ve shown in the analysis of older individuals (ages 75-84), cirrhosis and fibrosis of the liver was the main contributor to changes in deaths rates from liver diseases from 2020 to 2023. Consequently, increased levels of alcohol consumption during the pandemic years, are unlikely to be a significant contributory factor towards increased liver disease deaths for older individuals.
For the older age groups, excess deaths increased substantially in 2021, 2022 and 2023, showing extreme deviations from the prior 2013-2019 trend. Additionally, as illustrated by the detailed analysis of the 75-84 age group , even as excess all-cause deaths declined in 2022 and 2023, excess death rates from liver diseases continued to rise. The results suggest that the COVID-19 disease, pandemic lockdowns, or increased alcohol consumption are unlikely explanations for the rise in excess liver disease death rates, for older individuals. The prioritisation of older individuals to receive the COVID-19 inoculations or cumulative exposure to SARS-Cov2, might be better explanations for the observed pattern.
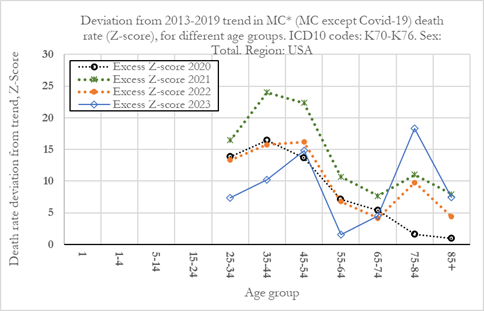
In this section we compute, for all 10-year age groups, the excess MC* death rates from liver diseases (K70-K76) in 2020, 2021, 2022 and 2023, shown in the Figures below (MC* excess death rates). As a reminder, MC* death rates refer to MC deaths from liver diseases except for those where COVID-19 is also reported (either as underlying cause or a contributing cause). In the Figure (left) we plot the excess MC* death rate (in percent) while Figure (right) shows the respective Z-scores. For a detailed view of the results refer to section 8.1, in the appendix of the full paper.


After removing COVID-19-related deaths, the results show that the excess MC* death rates exhibit a similar pattern to UC excess death rates for the different age groups. This is likely due to the rise in MC* death rates being driven by the rises in UC death rates.
For older individuals, aged 75-84 and 85+, after removing COVID-19-related deaths, we observe statistically insignificant excess MC* death rates in 2020, in similarity to observed for UC death rates. Excess death rates rose substantially from 2021, remaining high in 2022 and 2023, with very high statistical significance.
For individuals aged 65 and younger, excess death rates peaked in 2020 and 2021 and then declined in 2022 and 2023. The excess death rates in general show very high levels of statistical significance, as shown in Figure (Right) above. For younger individuals, the brunt of the effect was felt in 2020 and 2021, while for older individuals, the excess death rates peaked in 2023.
Other components of Liver Disease Deaths report:
